7.9 KiB
| parent | grand_parent | nav_order |
|---|---|---|
| Set up a local workspace | Getting into the code | 12 |
Step 2: Set up the build system: JDK and Gradle
Ensure that JDK 21 is available to IntelliJ
Ensure you have a Java 21 SDK configured by navigating to File > Project Structure... > Platform Settings > SDKs.
Note: In some MacBooks, Project Structure can be found at the "IntelliJ" button of the app menu instead of at "File".
{% figure caption:"JDKs 11, 14, and 15 shown in available SDKs. JDK 21 is missing." %}
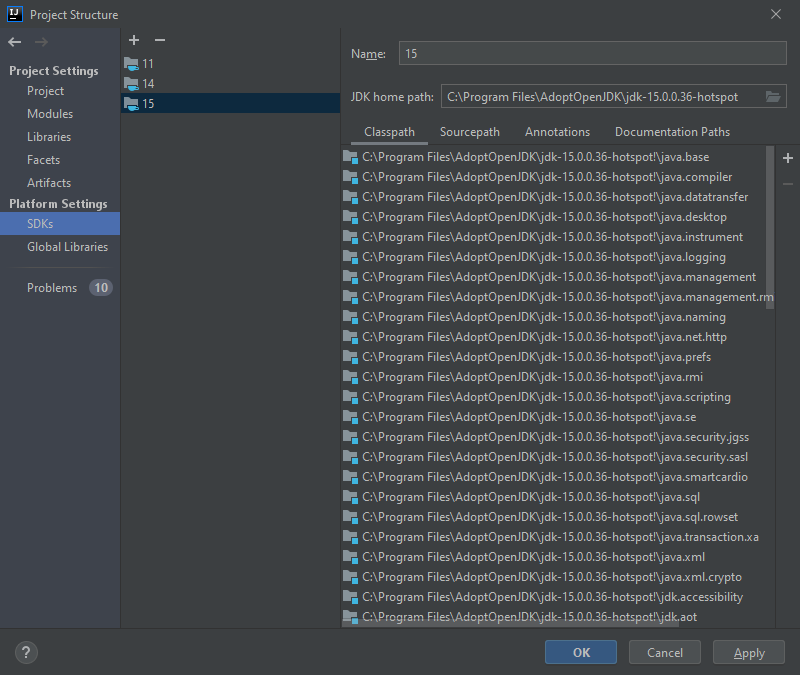 {% endfigure %}
If there is another JDK than JDK 21 selected, click on the plus button and choose "Download JDK..."
{% figure caption:"Download JDK..." %}
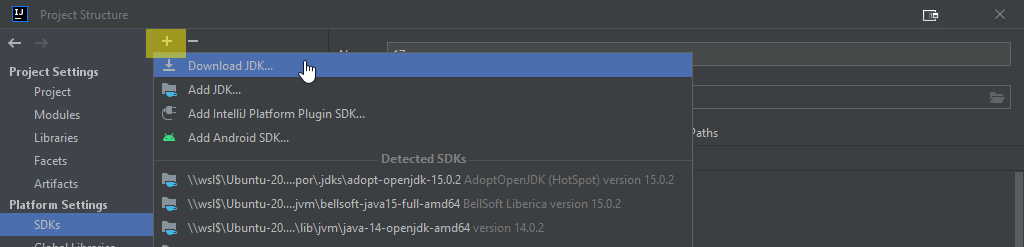 {% endfigure %}
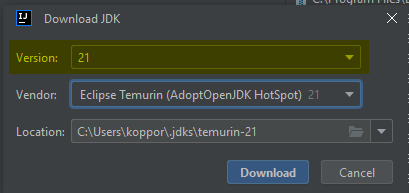
Select JDK version 21 and then Eclipse Temurin.
{% figure caption:"Example for JDK 21 - Choose Eclipse Temurin" %}
 {% endfigure %}
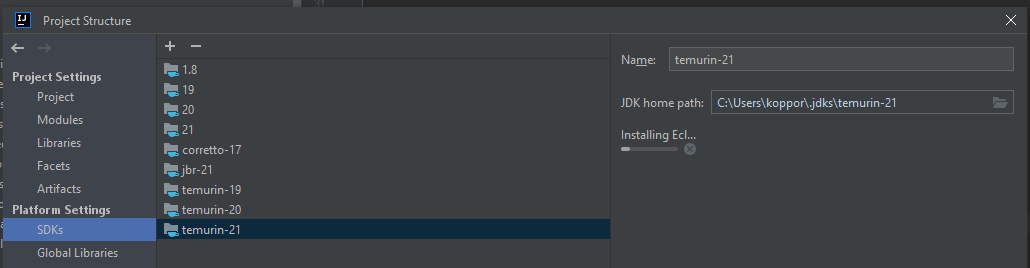
After clicking "Download", IntelliJ installs Eclipse Temurin:
{% figure caption:"IntelliJ installs Eclipse Temurin" %}
 {% endfigure %}
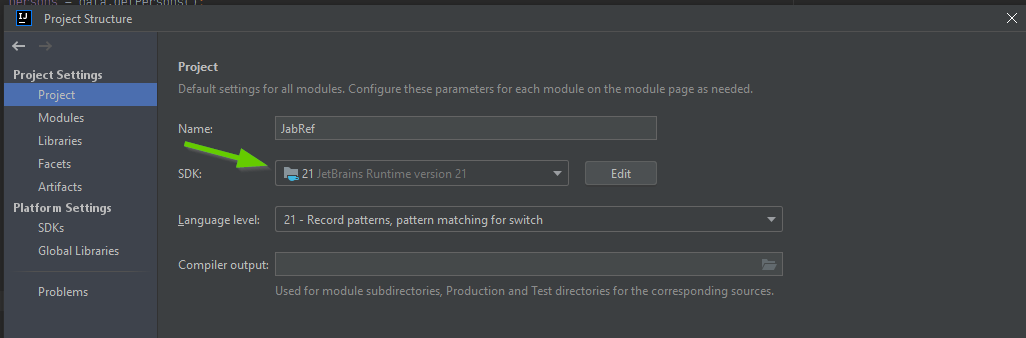
Navigate to Project Settings > Project and ensure that the projects' SDK is Java 21.
{% figure caption:"Project SDK is pinned to the downloaded SDK (showing JDK 21 as example)" %}
 {% endfigure %}
Click "OK" to store the changes.
Ensure correct JDK setting for Gradle
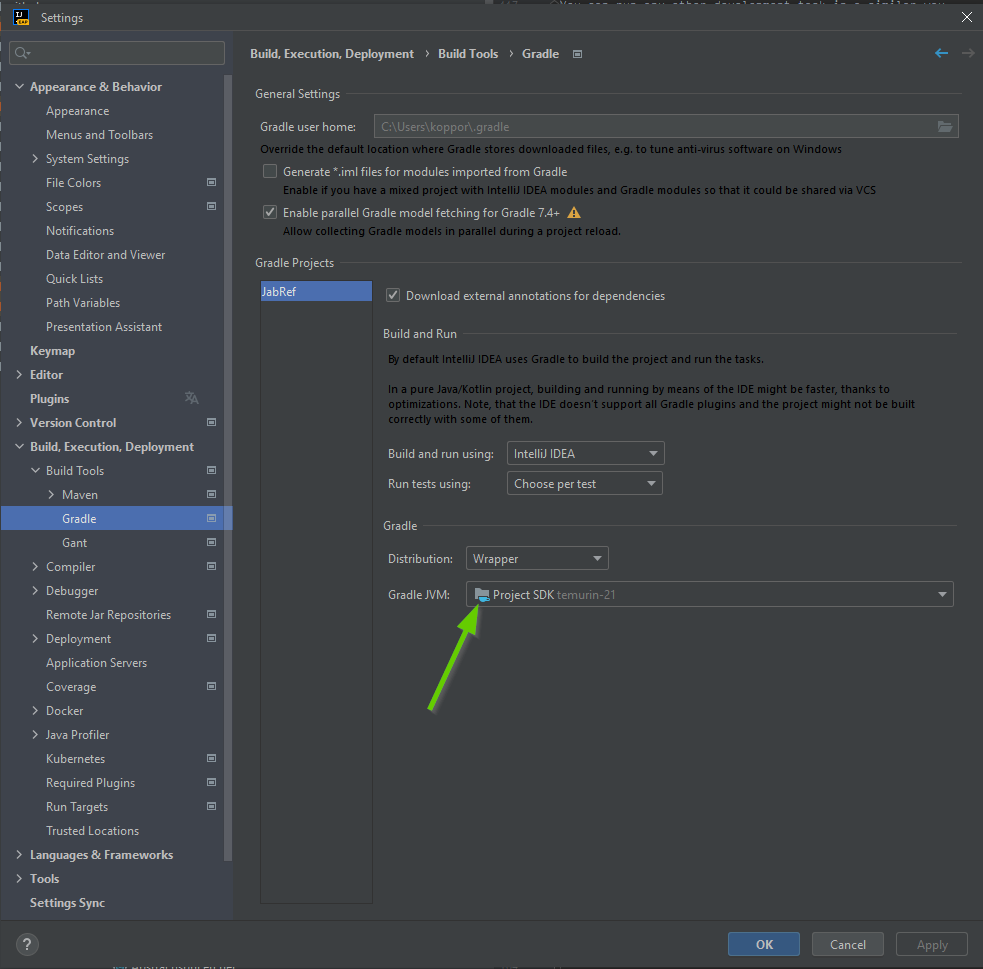
Navigate to File > Settings... > Build, Execution, Deployment > Build Tools > Gradle and select the "Project SDK" as the Gradle JVM at the bottom. If that does not exist, just select JDK 21.
{% figure caption:"Gradle JVM is project SDK (showing "Projekt SDK temurin-21" as example)" %}
 {% endfigure %}
Enable compiliation by IntelliJ
To prepare IntelliJ's build system additional steps are required:
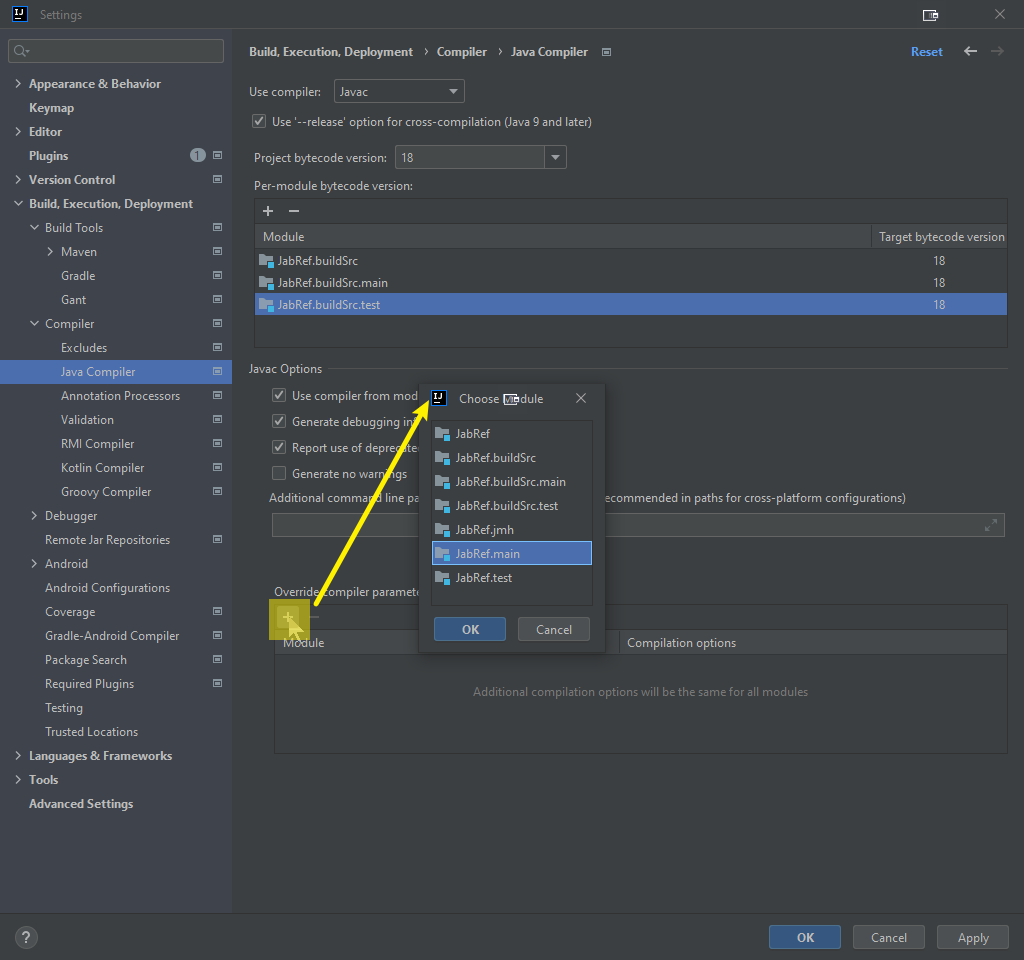
Navigate to Build, Execution, Deployment > Compiler > Java Compiler, and under "Override compiler parameters per-module", click add ([+]) and choose JabRef.main:
{% figure caption:"Choose JabRef.main" %}
 {% endfigure %}
Copy following text into your clipboard:
--add-exports=javafx.controls/com.sun.javafx.scene.control=org.jabref
--add-exports=org.controlsfx.controls/impl.org.controlsfx.skin=org.jabref
--add-reads org.jabref=org.apache.commons.csv
--add-reads org.jabref=org.fxmisc.flowless
--add-reads org.jabref=langchain4j.core
--add-reads org.jabref=langchain4j.open.ai
Then double click inside the cell "Compilation options". Press Ctrl+A to mark all text. Press Ctrl+V to paste all text. Press Enter to have the value really stored. Otherwise, it seems like the setting is stored, but it is not there if you reopen this preference dialog.
Note: If you use the expand arrow, you need to press Shift+Enter to close the expansion and then Enter to commit the value.
{% figure caption:"Resulting settings for module JabRef.main" %}
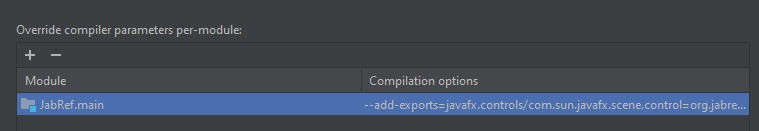 {% endfigure %}
Then click on "Apply" to store the setting.
Note: If this step is omitted, you will get: java: package com.sun.javafx.scene.control is not visible (package com.sun.javafx.scene.control is declared in module javafx.controls, which does not export it to module org.jabref).
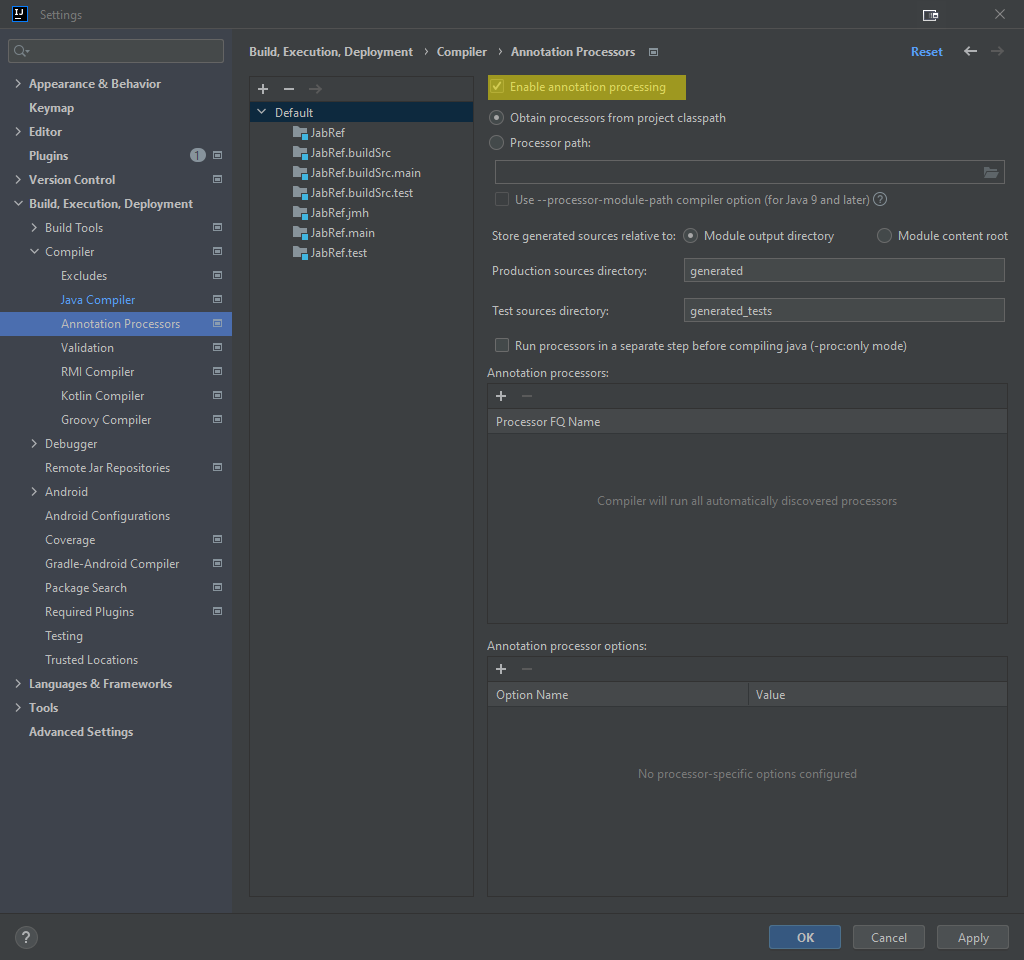
Enable annotation processors
Enable annotation processors by navigating to Build, Execution, Deployment > Compiler > Annotation processors and check "Enable annotation processing"
{% figure caption:"Enabled annotation processing" %}
 {% endfigure %}
Using Gradle from within IntelliJ IDEA
{: .note } Ensuring JabRef builds with Gradle should always be the first step because, e.g. it generates additional sources that are required for compiling the code.
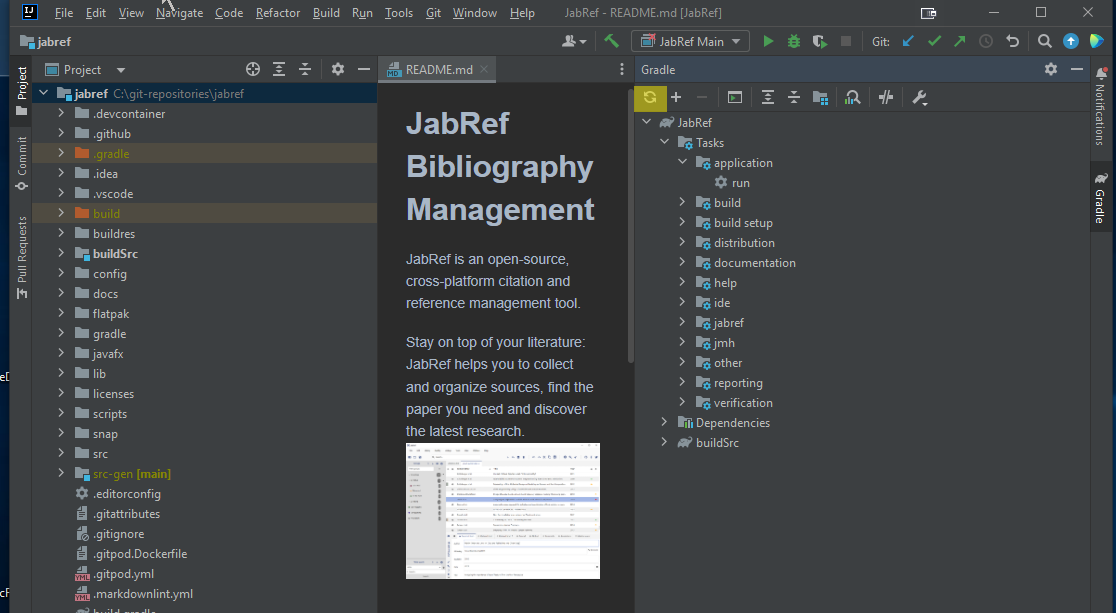
Open the Gradle Tool Window with the small button that can usually be found on the right side of IDEA or navigate to View > Tool Windows > Gradle. In the Gradle Tool Window, press the "Reload All Gradle Projects" button to ensure that all settings are up-to-date with the setting changes.
{% figure caption:"Reload of Gradle project" %}
 {% endfigure %}
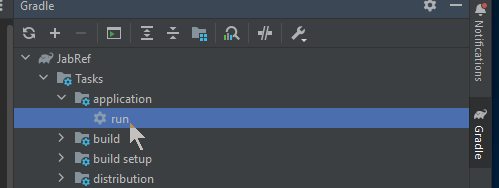
After that, you can use the Gradle Tool Window to build all parts of JabRef and run it. To do so, expand the JabRef project in the Gradle Tool Window and navigate to Tasks. From there, you can build and run JabRef by double-clicking JabRef > Tasks > application > run.
{% figure caption:"JabRef > Tasks > application > run" %}
 {% endfigure %}
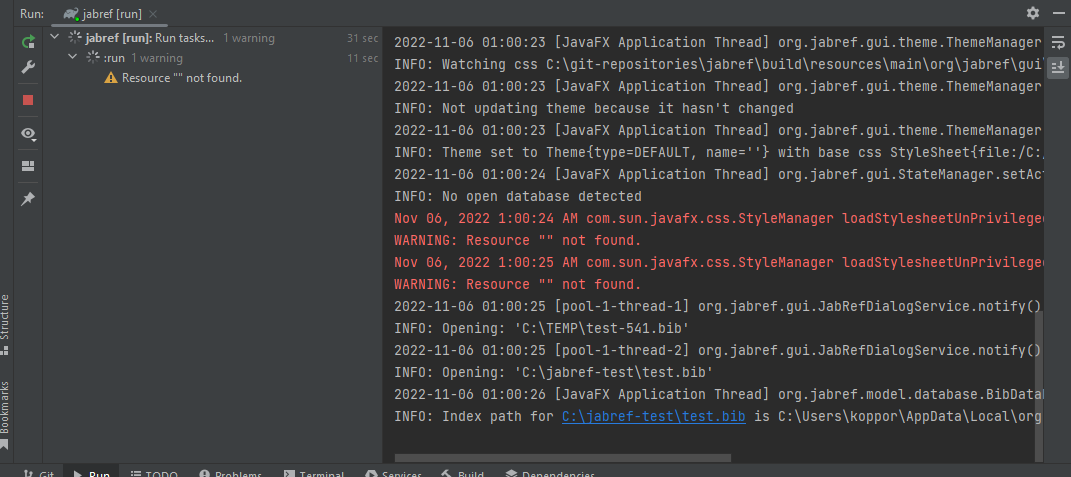
The Gradle run window opens, shows compilation and then the output of JabRef. The spinner will run as long as JabRef is open.
{% figure caption:"Gradle run Window" %}
 {% endfigure %}
You can close JabRef again.
After that a new entry called "jabref [run]" appears in the run configurations. Now you can also select "jabref [run]" and either run or debug the application from within IntelliJ.
{: .note } You can run any other development task in a similar way.
Using IntelliJ's internal build system for tests
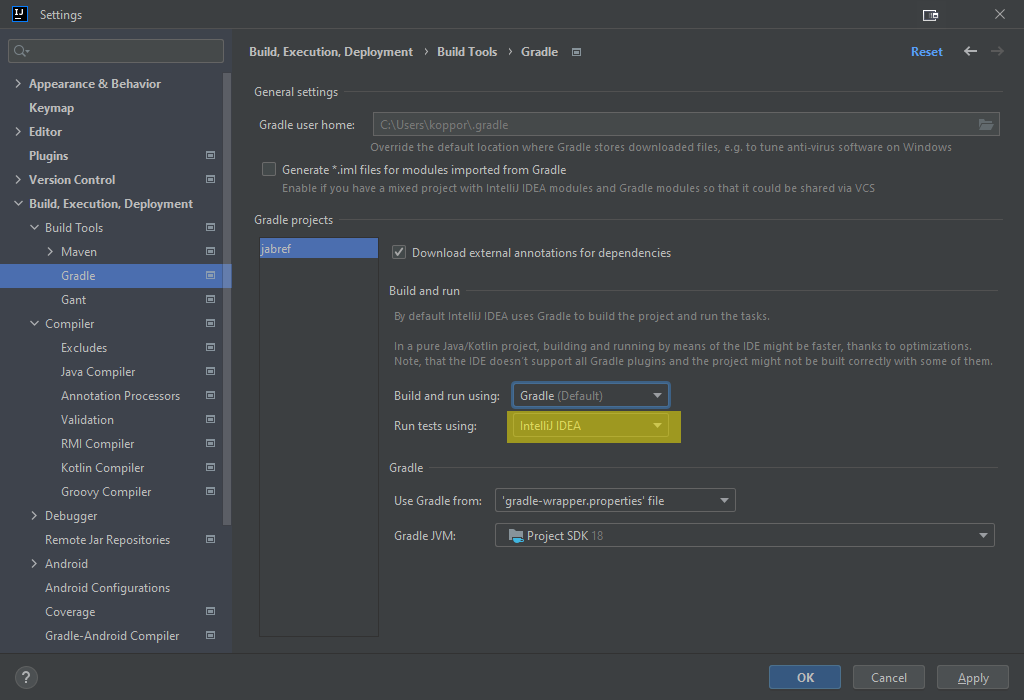
In File > Settings... > Build, Execution, Deployment > Build Tools > Gradle the setting "Run tests using:" is set to "IntelliJ IDEA".
{% figure caption:"IntelliJ setting: Run tests using IntelliJ" %}
 {% endfigure %}
{: .note } In case there are difficulties later, this is the place to switch back to gradle.
Click "OK" to close the preference dialog.
In the menu bar, select Build > Rebuild project.
IntelliJ now compiles JabRef. This should happen without any error.
Now you can use IntelliJ IDEA's internal build system by using Build > Build Project.
Final build system checks
To run an example test from IntelliJ, we let IntelliJ create a launch configuration:
Locate the class BibEntryTest:
Press Ctrl+N.
Then, the "Search for classes dialog" pops up.
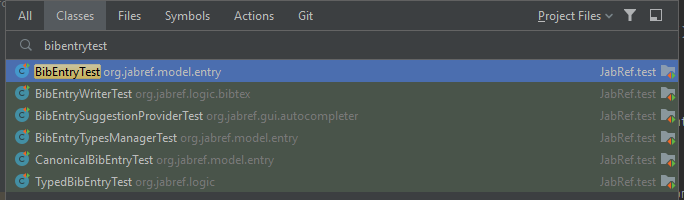
Enter bibentrytest.
Now, BibEntryTest should appear first:
{% figure caption:"IntelliJ search for class “BibEntryTest”" %}
 {% endfigure %}
Press Enter to jump to that class.
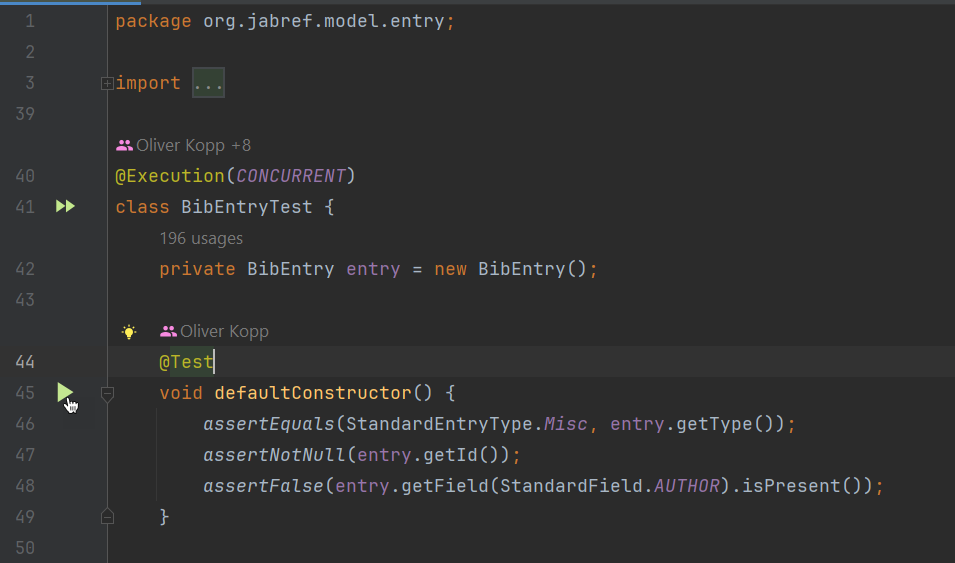
Hover on the green play button on defaultConstructor:
{% figure caption:"However on green play button" %}
 {% endfigure %}
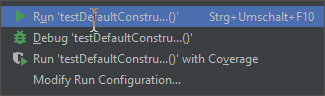
Then, click on it. A popup menu opens. Choose the first entry "Run testDefaultConstructor" and click on it.
{% figure caption:"Run testDefaultConstructor" %}
 {% endfigure %}
Then, the single test starts.
You also have an entry in the Launch configurations to directly launch the test. You can also click on the debug symbol next to it to enable stopping at breakpoints.
{% figure caption:"Launch menu contains BibEntry test case" %}
 {% endfigure %}
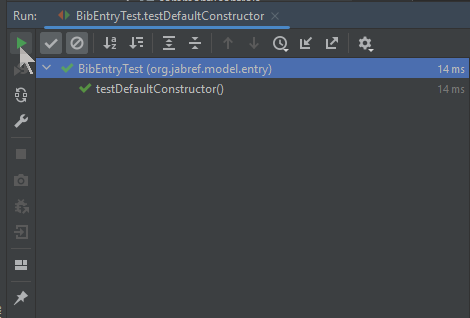
The tests are green after the run. You can also use the play button there to re-execute the tests. A right-click on "BibEntryTests" enables the debugger to start.
{% figure caption:"Run window for the BibEntry test case" %}
 {% endfigure %}