de-p1st-monitor
Research
See ./research.
- HDD temp:
- Modern hard drives will throttle their read and write speeds when the drive reaches a critical pre-set temperature (usually around 60°C)
- 20-50°C (short-term)
- 20-40°C (long-term usage)
- SSD temp:
- Most SSDs implement thermal throttling as a safety feature if a drive gets too hot. As the driver approaches the 70ºC limit that most manufacturers set, the more likely it is that the drive will start to slow itself down to prevent failure.
- 30-50°C
Keep it simple!
Lines of code including docstrings and comments:
find ./src -name '*.py' | xargs wc -l
#=> 1938 total
Configuration
The configuration is selected in the following order:
- Given as CLI argument
- Located at
/etc/de-p1st-monitor/${hostname}.ini
See example.ini for a configuration file covering all config options.
More examples can be found at https://codeberg.org/privacy1st/nix-git/src/branch/main/assets/de-p1st-monitor.
Installation
The package is available on PyPI.
There are two system dependencies which are required for some config options: smartmontools and digitemp.
Furthermore, the kernel module drivetemp is required: sudo modprobe drivetemp
Installation with cron entry
Install dependencies on Ubuntu:
sudo apt-get install python3-pip

# Ubuntu 18.04 and below
sudo apt-get install python3-setuptools
sudo apt-get install python3-wheel

sudo apt-get install python3-psutil

# Ubuntu 18.04 and below: psutil < 5.6.2
sudo apt-get install python3-dev
sudo apt-get install build-essential
# Ubuntu 20.04 and below: psutil < 5.6.2
sudo python3 -m pip install psutil --upgrade
Install:
- Arch Linux:
make install-pkgbuild - pip:
make install-pip
Usage
Command line interface
usage: de-p1st-monitor [-h] [--config CONFIG] [--export]

Iterates over all config sections. For each section the current sensor data is
read and logged to a .csv file.

options:
  -h, --help            show this help message and exit
  --config CONFIG, -c CONFIG
                        Path to .ini configuration file.
  --export, -e          If `True`, export .csv files and print their paths to
                        stdout. No sensor data is logged during this.
Periodic logging
Add a cron entry executing this e.g. every 3 Minutes:
de-p1st-monitor
Example log files
ssh myServer 'tail -n 1 /var/log/de-p1st-monitor/*'
==> /var/log/de-p1st-monitor/cpu_15min.csv <==
20230712T101202,0.1351318359375
==> /var/log/de-p1st-monitor/cpu_1min.csv <==
20230712T101201,0.2215576171875
==> /var/log/de-p1st-monitor/cpu_5min.csv <==
20230712T101201,0.155517578125
==> /var/log/de-p1st-monitor/drive_20d86155-30d4-404c-95e8-c701cfb16ca5.csv <==
20230712T101202,27
==> /var/log/de-p1st-monitor/drive_4651c3f1-e4b8-45aa-a823-df762530a307.csv <==
20230712T101202,27
==> /var/log/de-p1st-monitor/drive_68c349e8-5118-4773-9fd5-5dbad9acee4e.csv <==
20230712T101202,30
==> /var/log/de-p1st-monitor/drive_b8ef1da9-d76d-44b4-86d4-71c82c888b6f.csv <==
20230712T101202,42
==> /var/log/de-p1st-monitor/filesystem_3CBA-B4EA.csv <==
20230712T101201,0.22699999999999998
==> /var/log/de-p1st-monitor/filesystem_a454430b-dee3-4b6b-8325-f7bdb9435ed1.csv <==
20230712T101201,nan
==> /var/log/de-p1st-monitor/filesystem_b8ef1da9-d76d-44b4-86d4-71c82c888b6f.csv <==
20230712T101201,0.28300000000000003
==> /var/log/de-p1st-monitor/filesystem_c385a436-0288-486f-a2b9-c64c2db667e7.csv <==
20230712T101201,0.397
==> /var/log/de-p1st-monitor/memory.csv <==
20230712T101201,3331,7434,7966
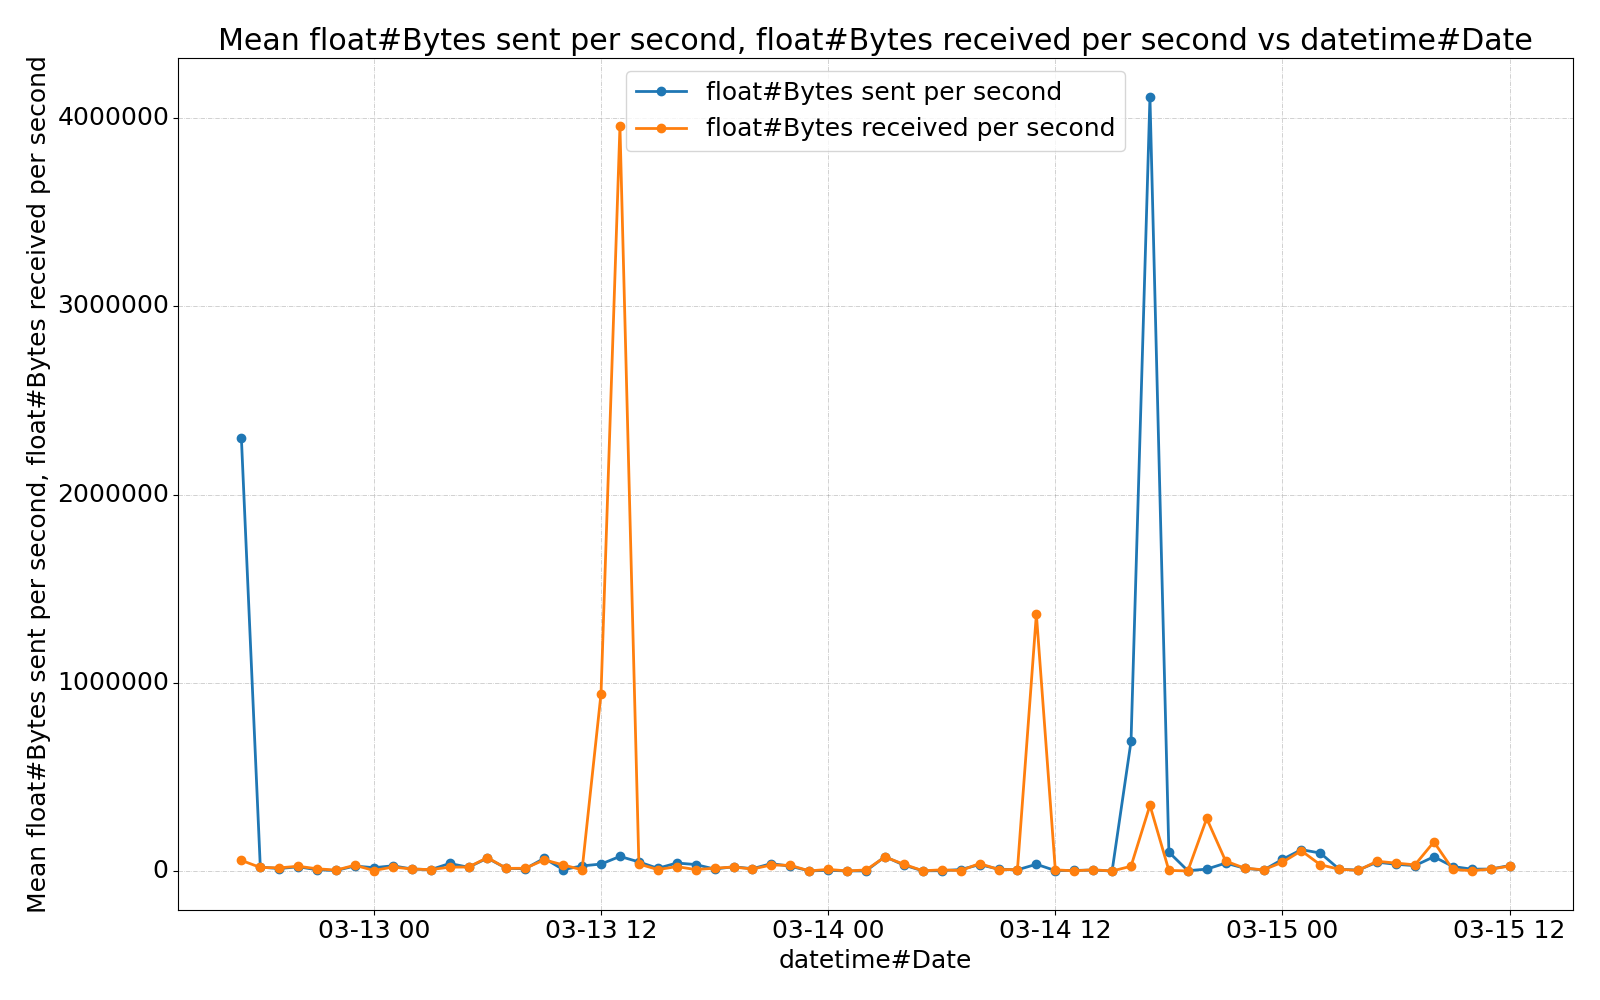
==> /var/log/de-p1st-monitor/net_enp0s31f6.csv <==
20230712T101202,34945986870,32771833466,20230706T100247
==> /var/log/de-p1st-monitor/net_enp0s31f6.csv.exported.csv <==
20230619T203731,68129.75690607735,67623.71270718232
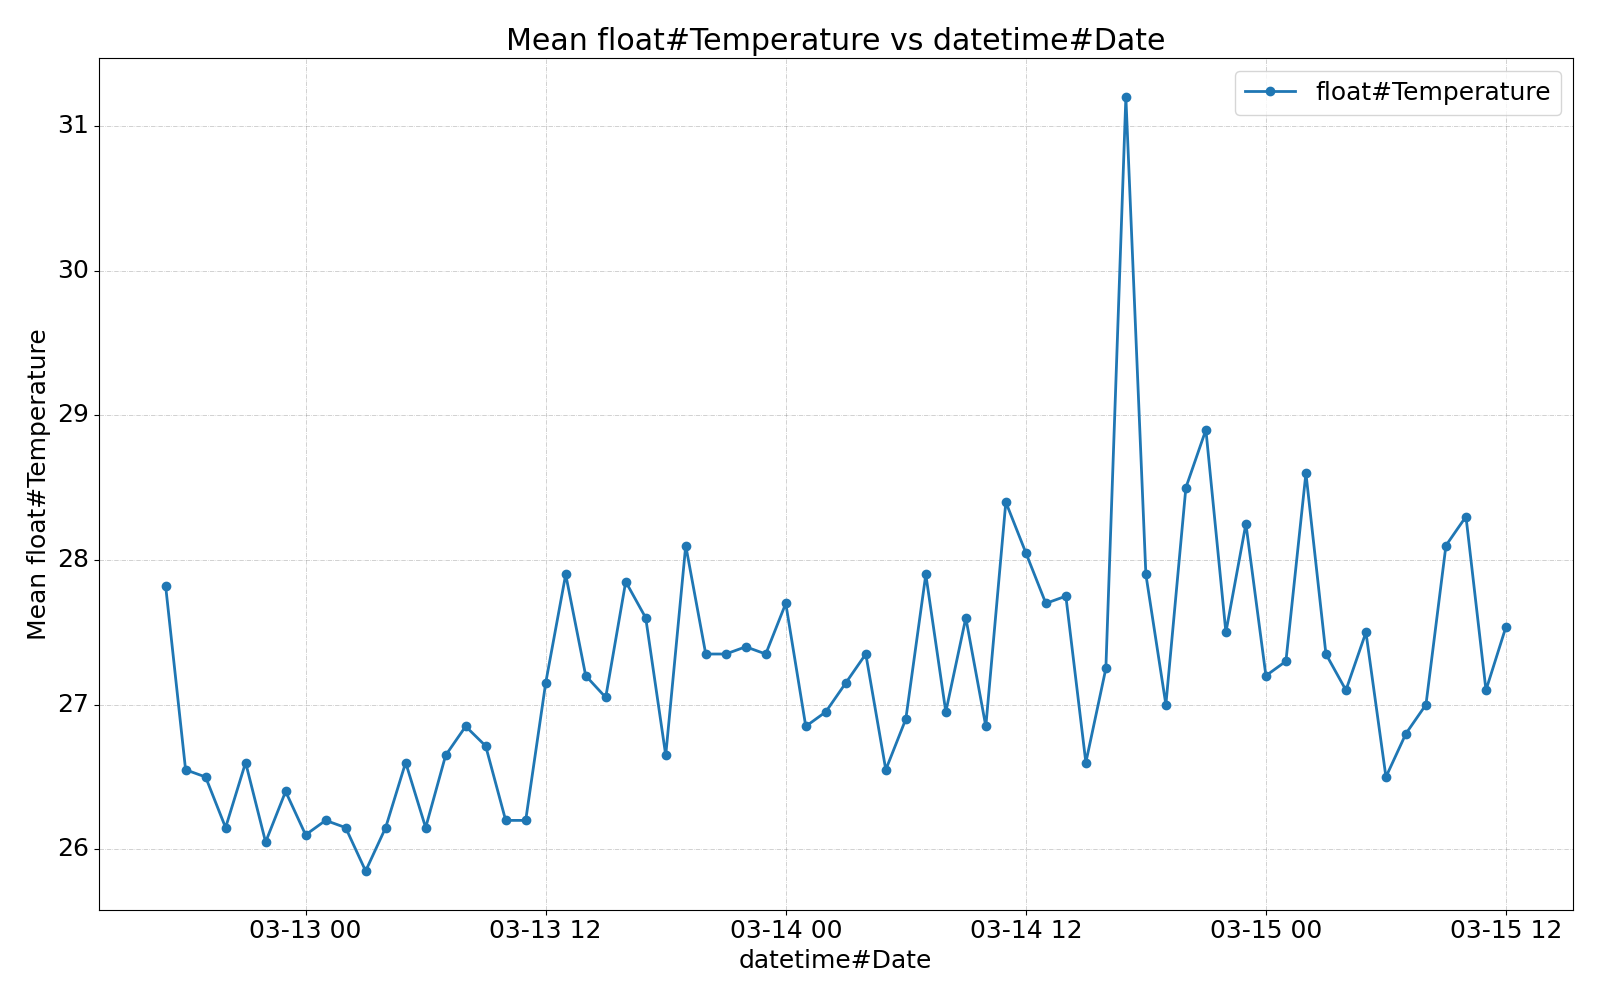
==> /var/log/de-p1st-monitor/sensor_script_room-temp.csv <==
20230712T101202,26.19
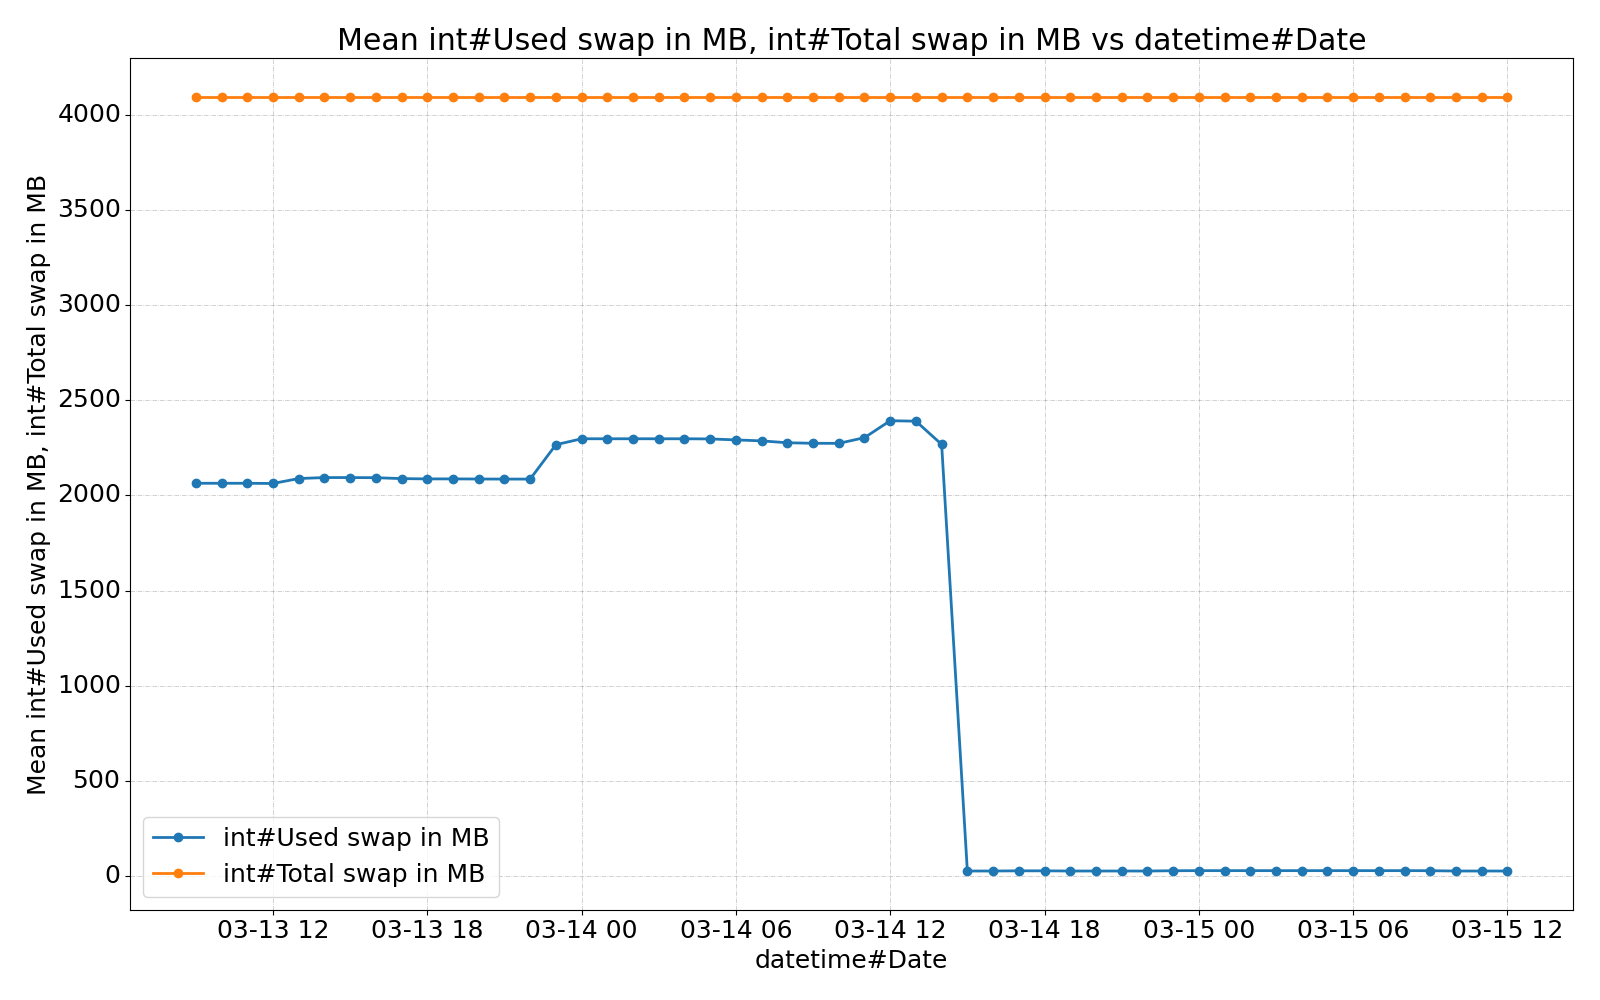
==> /var/log/de-p1st-monitor/swap.csv <==
20230712T101201,2375,32767
==> /var/log/de-p1st-monitor/temp_coretemp_Core 0.csv <==
20230712T101202,33.0
==> /var/log/de-p1st-monitor/temp_coretemp_Core 1.csv <==
20230712T101202,39.0
==> /var/log/de-p1st-monitor/temp_coretemp_Package id 0.csv <==
20230712T101202,39.0
Plots
Creating plots with graph-cli
- Export and fetch data
ssh_target=rootNas
dst=~/de-p1st-monitor-"${ssh_target}"
files="${dst}".files

# Export .csv files on SSH target and save list of exported files to $files.
ssh "${ssh_target}" 'de-p1st-monitor --export' > "${files}"

rm -rf "${dst}"
mkdir -p "${dst}"

rsync --checksum --archive --progress --human-readable --delete \
  --files-from="${files}" "${ssh_target}":/ "${dst}"
mv "${dst}"/var/log/de-p1st-monitor/* "${dst}"
rm -r "${dst}"/var "${files}"

cd "${dst}"
- Install (Python)
graph-cli
# With a Python venv:
#python -m venv ~/de-p1st-monitor.venv
#source ~/de-p1st-monitor.venv/bin/activate
#pip install graph-cli
# With nix:
nix-shell -p graph-cli
- Create plots
Create one plot for each .csv file with different resampling methods (https://pandas.pydata.org/pandas-docs/stable/reference/resampling.html#computations-descriptive-stats):
function plot(){
  for file in "${@}"; do
    graph "${file}" -x 1 --resample "${sample_duration}" --resample-action "${action}" --figsize 1600x1000 -o "${file}".resample-"${sample_duration}-${action}".png || {
      echo "Error while processing ${file}"
    }
  done
}

# MEAN
sample_duration=24H
action=mean
plot {swap,memory}.csv {temp_,cpu_,sensor_script_}*.csv

# MAX
sample_duration=24H
action=max
plot {swap,memory}.csv {temp_,drive_,drive-temp_,net_,cpu_,filesystem_,sensor_script_}*.csv

# SUM
sample_duration=24H
action=sum
plot net_*.csv
- Create more plots as you like
Some self-explaining examples:
# x and y axis by column name
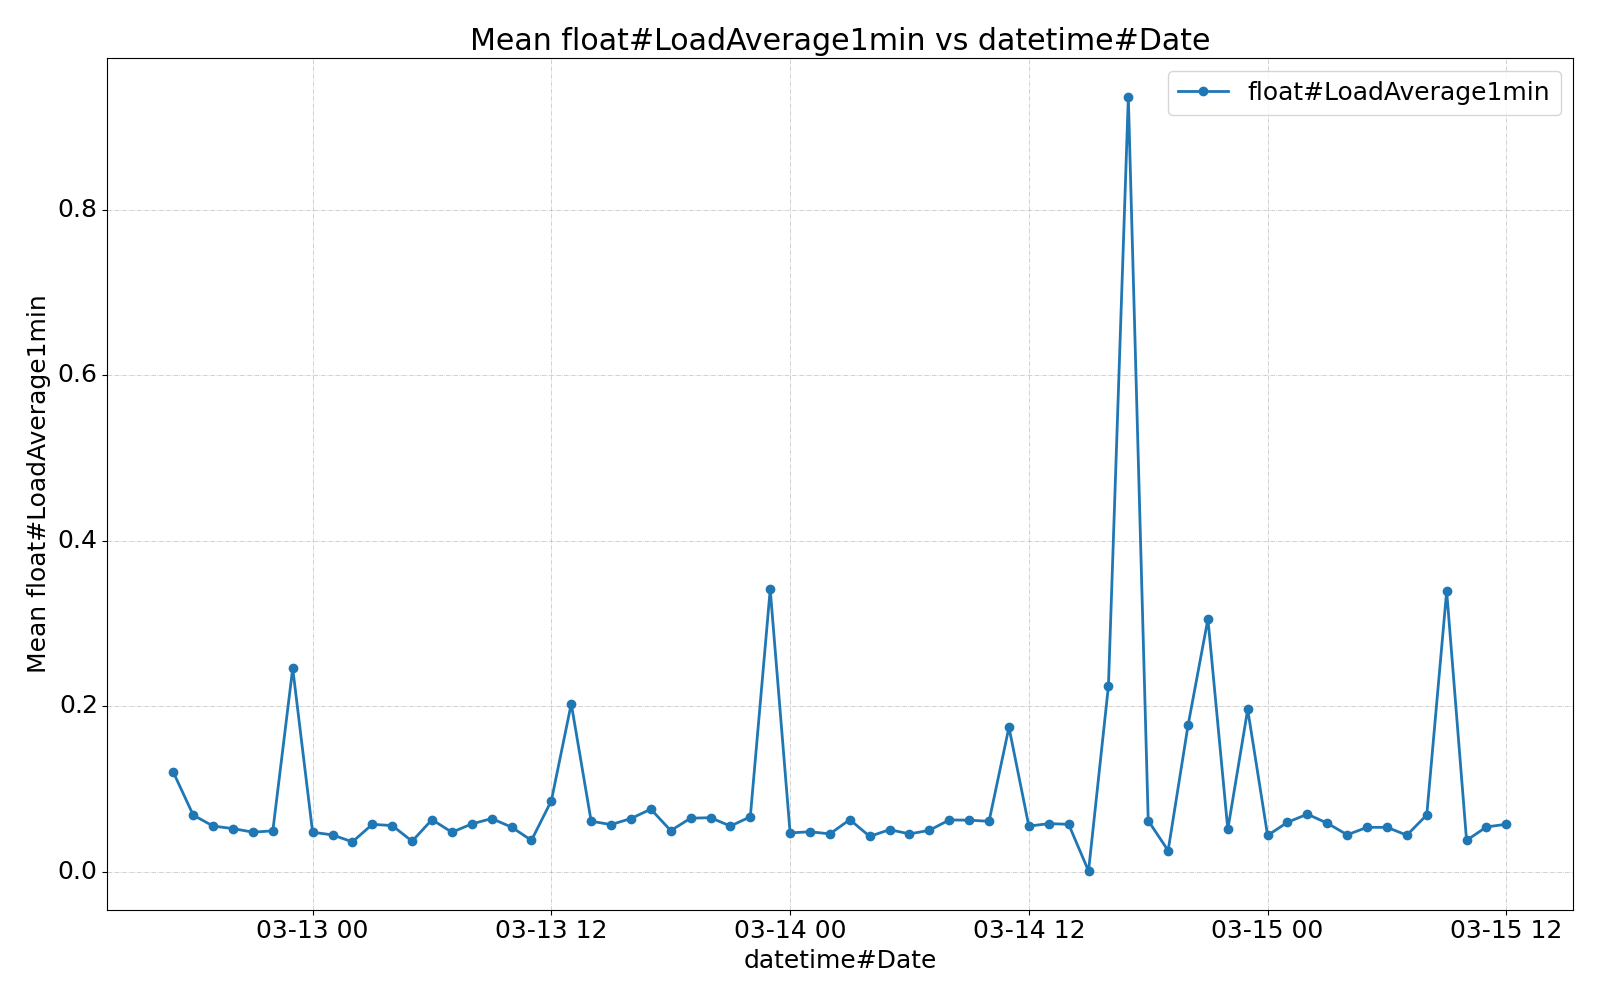
graph cpu_1min.csv -x 'datetime#Date' -y 'float#LoadAverage1min' --resample 1H -o cpu_1min_resample-1H.png
# x and y axis by column number
graph cpu_1min.csv -x 1 -y 2 --resample 1H -o cpu_1min_resample-1H.png
# specify x axis; use all other axes for y
graph cpu_1min.csv -x 1 --resample 1H -o cpu_1min_resample-1H.png
# increased plot size
graph cpu_1min.csv -x 1 --resample 1H --figsize 1600x1000 -o cpu_1min_resample-1H.png
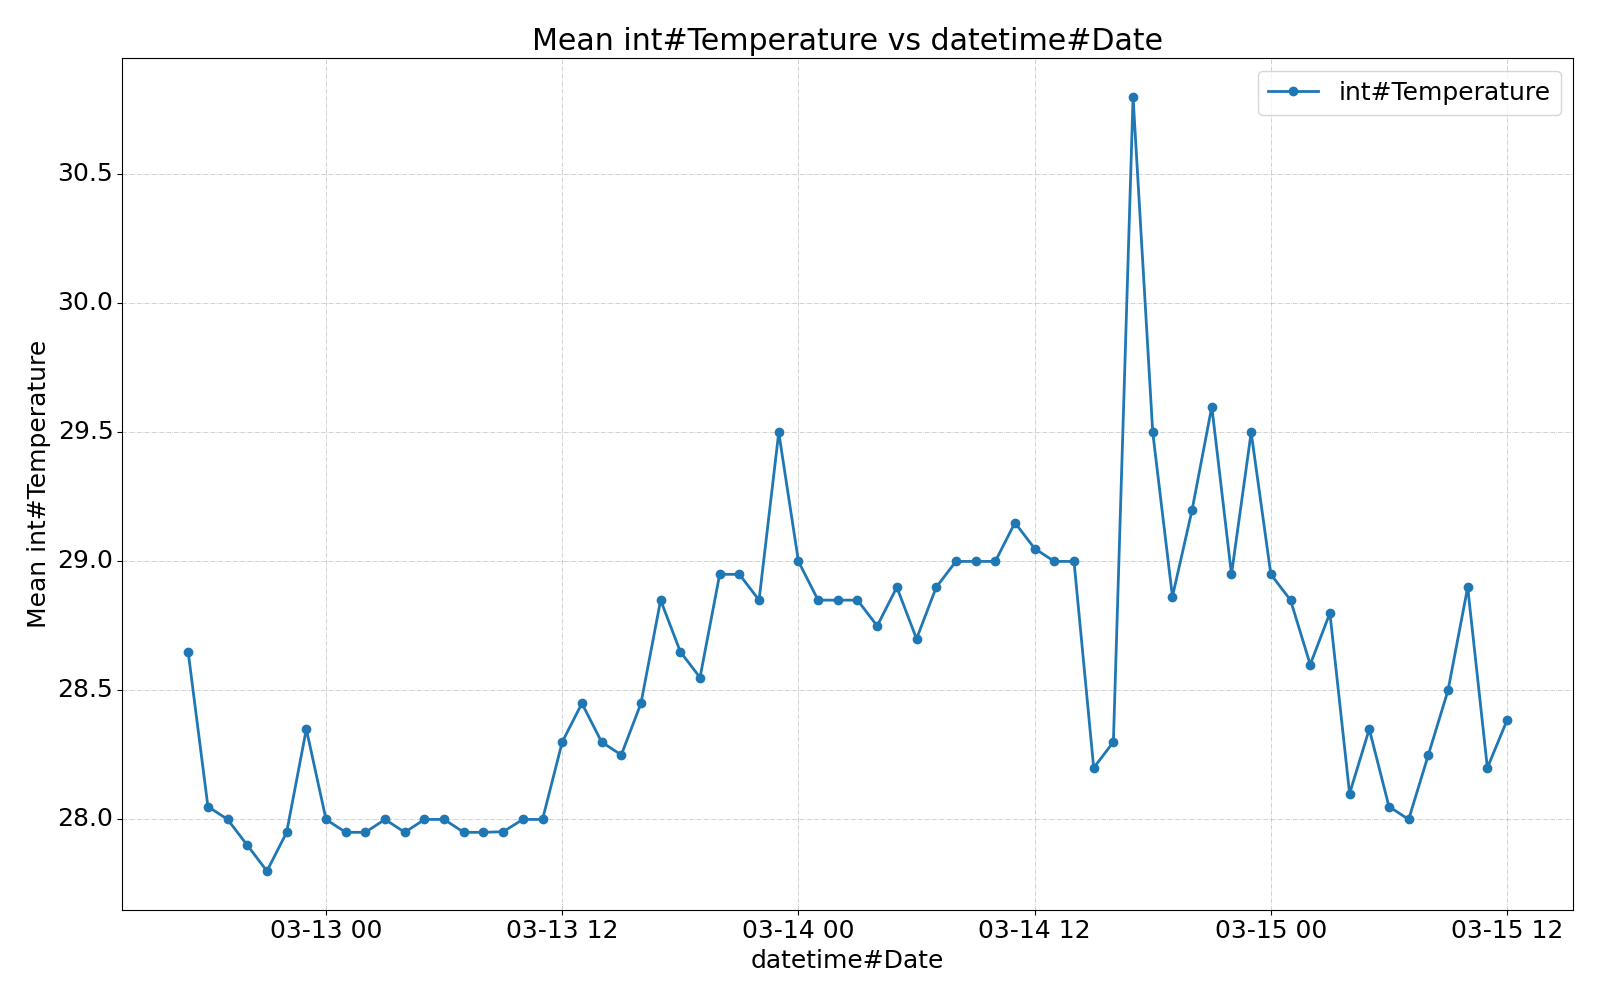
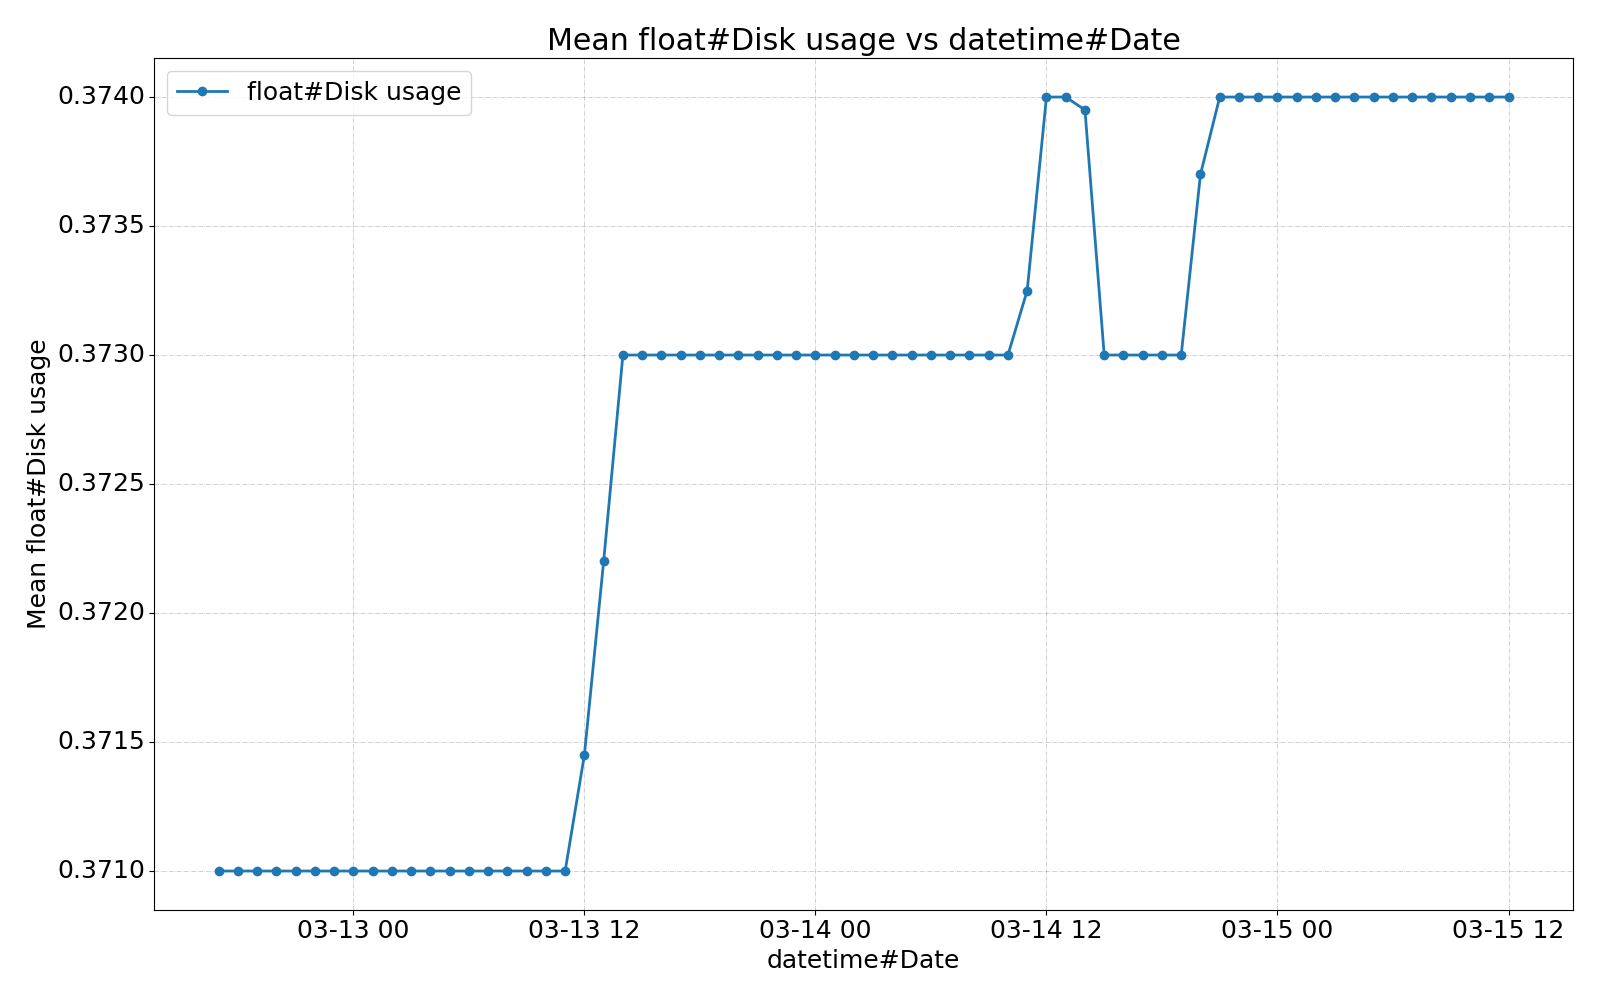
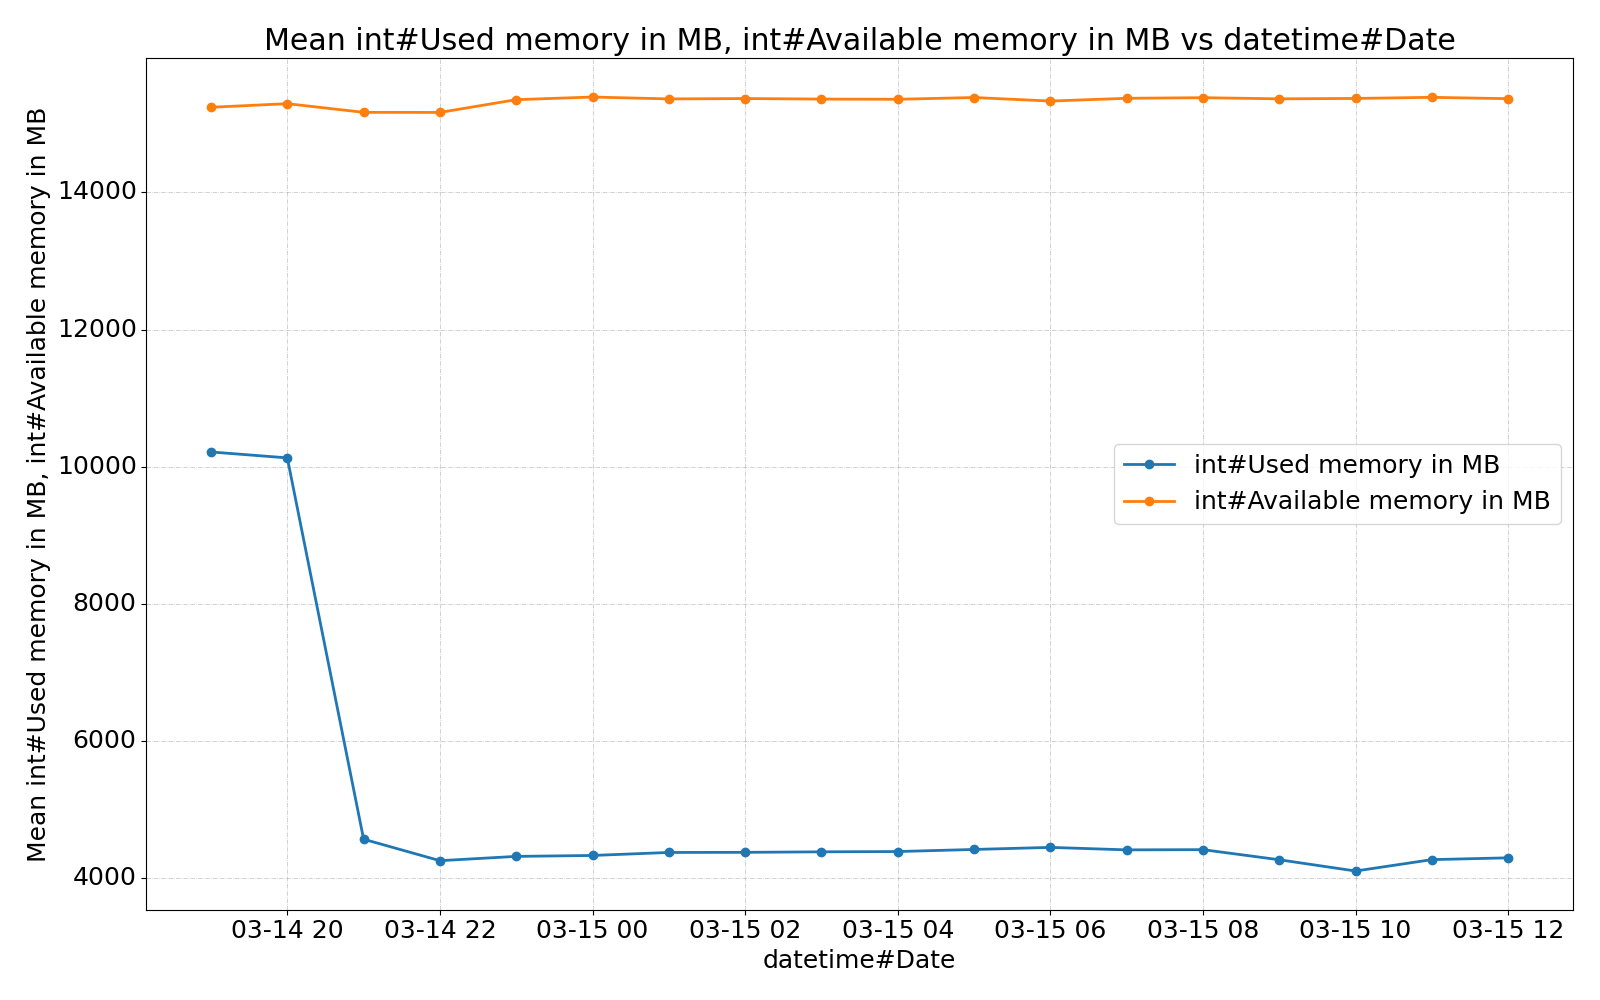
Example plots